Batu Gendang And Batu Mandi
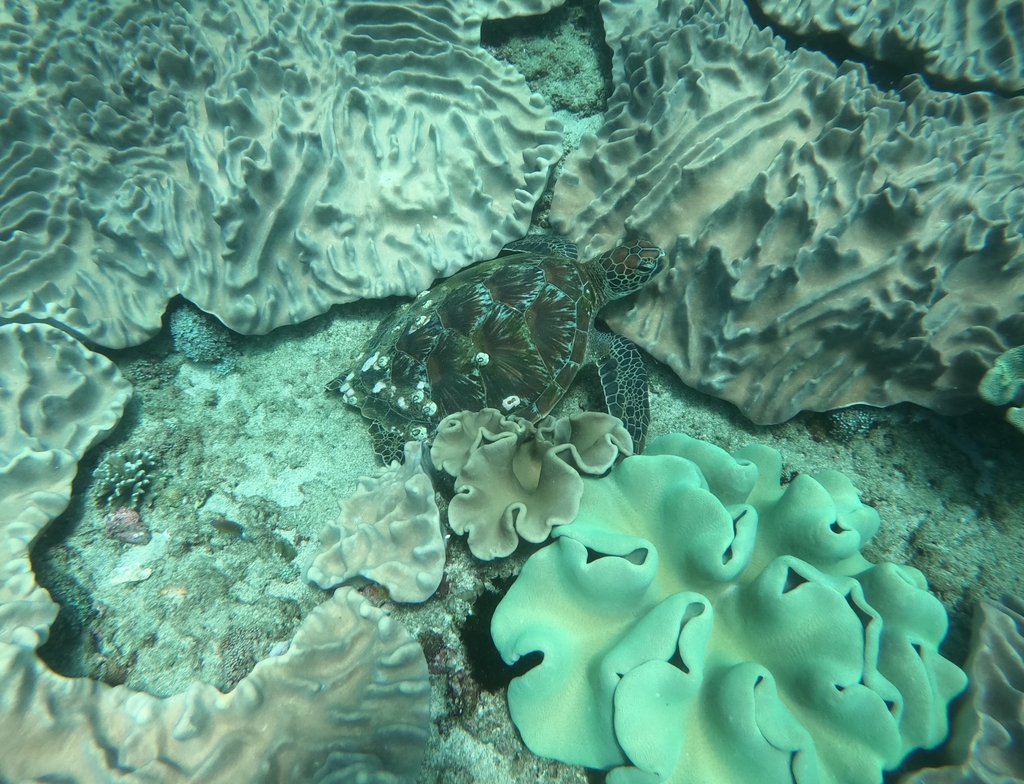
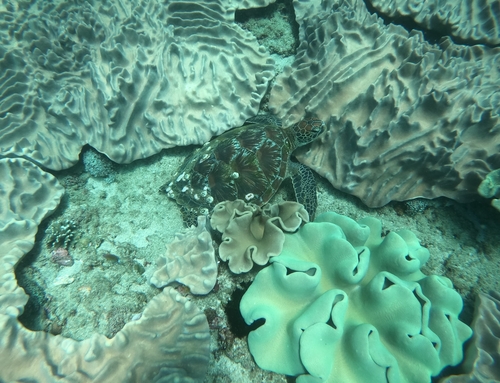
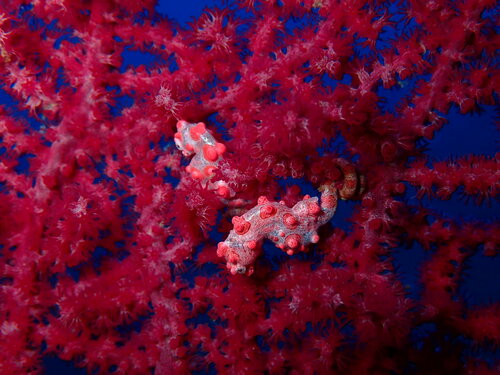
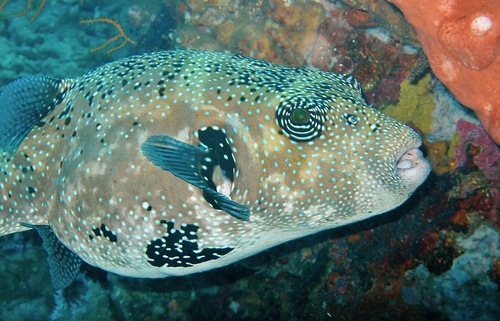
Batu Gendang And Batu Mandi is a dive site in Bali, Indonesia. It lies within the Gili Tangkong, Gili Nanggu, Gili Sudak Marine Recreation Park. The sea floor at the site position lies at about 10 meters. Currents typically run at 4.8 km/h and reach 7.9 km/h on the strongest days. Water temperatures range from 28°C in August to 30°C in April. The typical daily tidal range is about 1.4 m. Species recorded in the area include Phyllidia haegeli, Yellow Boxfish, Green Sea Turtle, Bump-head Mola and Pygmy Seahorse.
Dive Conditions
Data sources: currents and water temperature from Open-Meteo Marine (CC BY 4.0), hourly model values 2024; seabed depth from the GEBCO 2020 Grid, sampled at the site coordinates (grid resolution about 450 m). Tidal range is the median daily range of modelled sea level from Open-Meteo Marine, hourly values 2024. Protected area boundary from OpenStreetMap contributors (ODbL). Species observations from iNaturalist, checked against the World Register of Marine Species.
Conditions at Batu Gendang And Batu Mandi through the year
Sea surface temperature at the site coordinates, averaged per month from hourly model values for 2024. The water is warmest in April at about 30 °C and coolest in August at about 28 °C, a spread of 2.1 degrees across the year.
| Jan | Feb | Mar | Apr | May | Jun | Jul | Aug | Sep | Oct | Nov | Dec |
|---|---|---|---|---|---|---|---|---|---|---|---|
| 29.4 | 29.5 | 29.7 | 30.2 | 29.7 | 28.9 | 28.6 | 28.1 | 28.2 | 28.9 | 30.0 | 30.0 |
Ocean current at the site runs at a typical 4.8 km/h. In the strongest tenth of the hours modelled for 2024 it reaches 7.9 km/h, which is when entries are normally timed to slack water at the turn of the tide.
The tide moves the water level by a median 1.4 m over a day, and by up to 2.0 m on the largest days of the month. That range drives how much water is exchanged over the reef and when the current turns.
In the open sea off Batu Gendang And Batu Mandi, the highest wave of the day exceeded 1.5 m on 2.0 % of days between 2015 and 2024. The roughest month was July (5 % of days), the calmest April (0 %).
| Jan | Feb | Mar | Apr | May | Jun | Jul | Aug | Sep | Oct | Nov | Dec |
|---|---|---|---|---|---|---|---|---|---|---|---|
| 2 | 2 | 3 | 0 | 1 | 4 | 5 | 4 | 1 | 1 | 0 | 1 |
The seabed directly under the site coordinates sits at about 10 m. This is a bathymetry grid value with a cell size of roughly 450 m, so it describes the depth of the area rather than the deepest point a dive can reach.
Batu Gendang And Batu Mandi lies inside Gili Tangkong, Gili Nanggu, Gili Sudak Marine Recreation Park. Protected areas can carry their own rules on entry fees, permits, anchoring and fishing; check the current rules with a local operator before you dive.
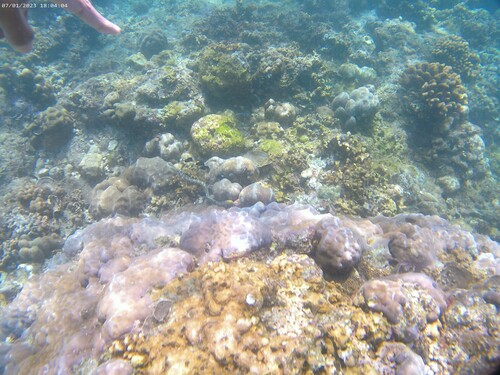
Satellite habitat mapping places Batu Gendang And Batu Mandi on an outer reef slope, over a seabed mapped as coral and algae.
How Batu Gendang And Batu Mandi compares
These comparisons use only the measured values above, set against the 376 dive sites published on findadive.com. A percentage shows the share of other sites with a lower (or higher) value, so it reads the same way wherever the site is. Batu Gendang And Batu Mandi sits with its typical current in the top tenth and its peak current in the top tenth of all listed sites.
| Measure | This site | Compared with all sites | Median in Bali |
|---|---|---|---|
| Mean water temperature | 29.3 °C | cooler than 64 % of the other 375 sites | 29.1 °C (99 sites) |
| Water temperature in the coolest month | 28.1 °C | cooler than 54 % of the other 375 sites | 27.8 °C (99 sites) |
| Typical current | 4.8 km/h | stronger than 99 % of the other 375 sites | 3.2 km/h (99 sites) |
| Current in the strongest 10 % of hours | 7.9 km/h | stronger than 96 % of the other 375 sites | 5.7 km/h (99 sites) |
| Median daily tidal range | 1.4 m | larger than 50 % of the other 375 sites | 1.5 m (99 sites) |
Water temperature, current and tide from Open-Meteo Marine (CC BY 4.0), hourly model values for 2024 at -8.7276°, 115.8373°. Seabed depth from the GEBCO 2020 Grid. Protected area boundary from OpenStreetMap contributors (ODbL). Wave statistics from ERA5-Ocean via Open-Meteo Marine (contains modified Copernicus Climate Change Service information 2015–2024), daily maximum wave height on a 0.5° grid; land shelter tested against Natural Earth coastlines. Reef structure and seabed cover from the Allen Coral Atlas © 2018–2023 Allen Coral Atlas Partnership and Arizona State University (CC BY 4.0).
Marine life recorded at this site
Research-grade observations from iNaturalist within about 12 km of these coordinates.